To trust an AI visibility number, run each prompt 20 to 30 times per week at minimum, because a single run is a coin toss, not a measurement. AI models are non-deterministic, so the same prompt gives different answers on different runs, even at temperature zero. That means one check does not measure your visibility; it measures which way the coin landed that day. The precision of your number improves with the square root of the run count, so to cut your margin of error in half you have to quadruple your runs, not double them. This is the honest math almost no one in the space talks about, and it is exactly why a five-point weekly “drop” usually means nothing, and why serious tracking has to be automated. Here is the arithmetic, with no data required, just statistics.
Every AI visibility tool reports a percentage. Almost none of them tell you how wide that percentage really is. Once you see the error bars, you read every number in this category differently.
One run is a coin toss
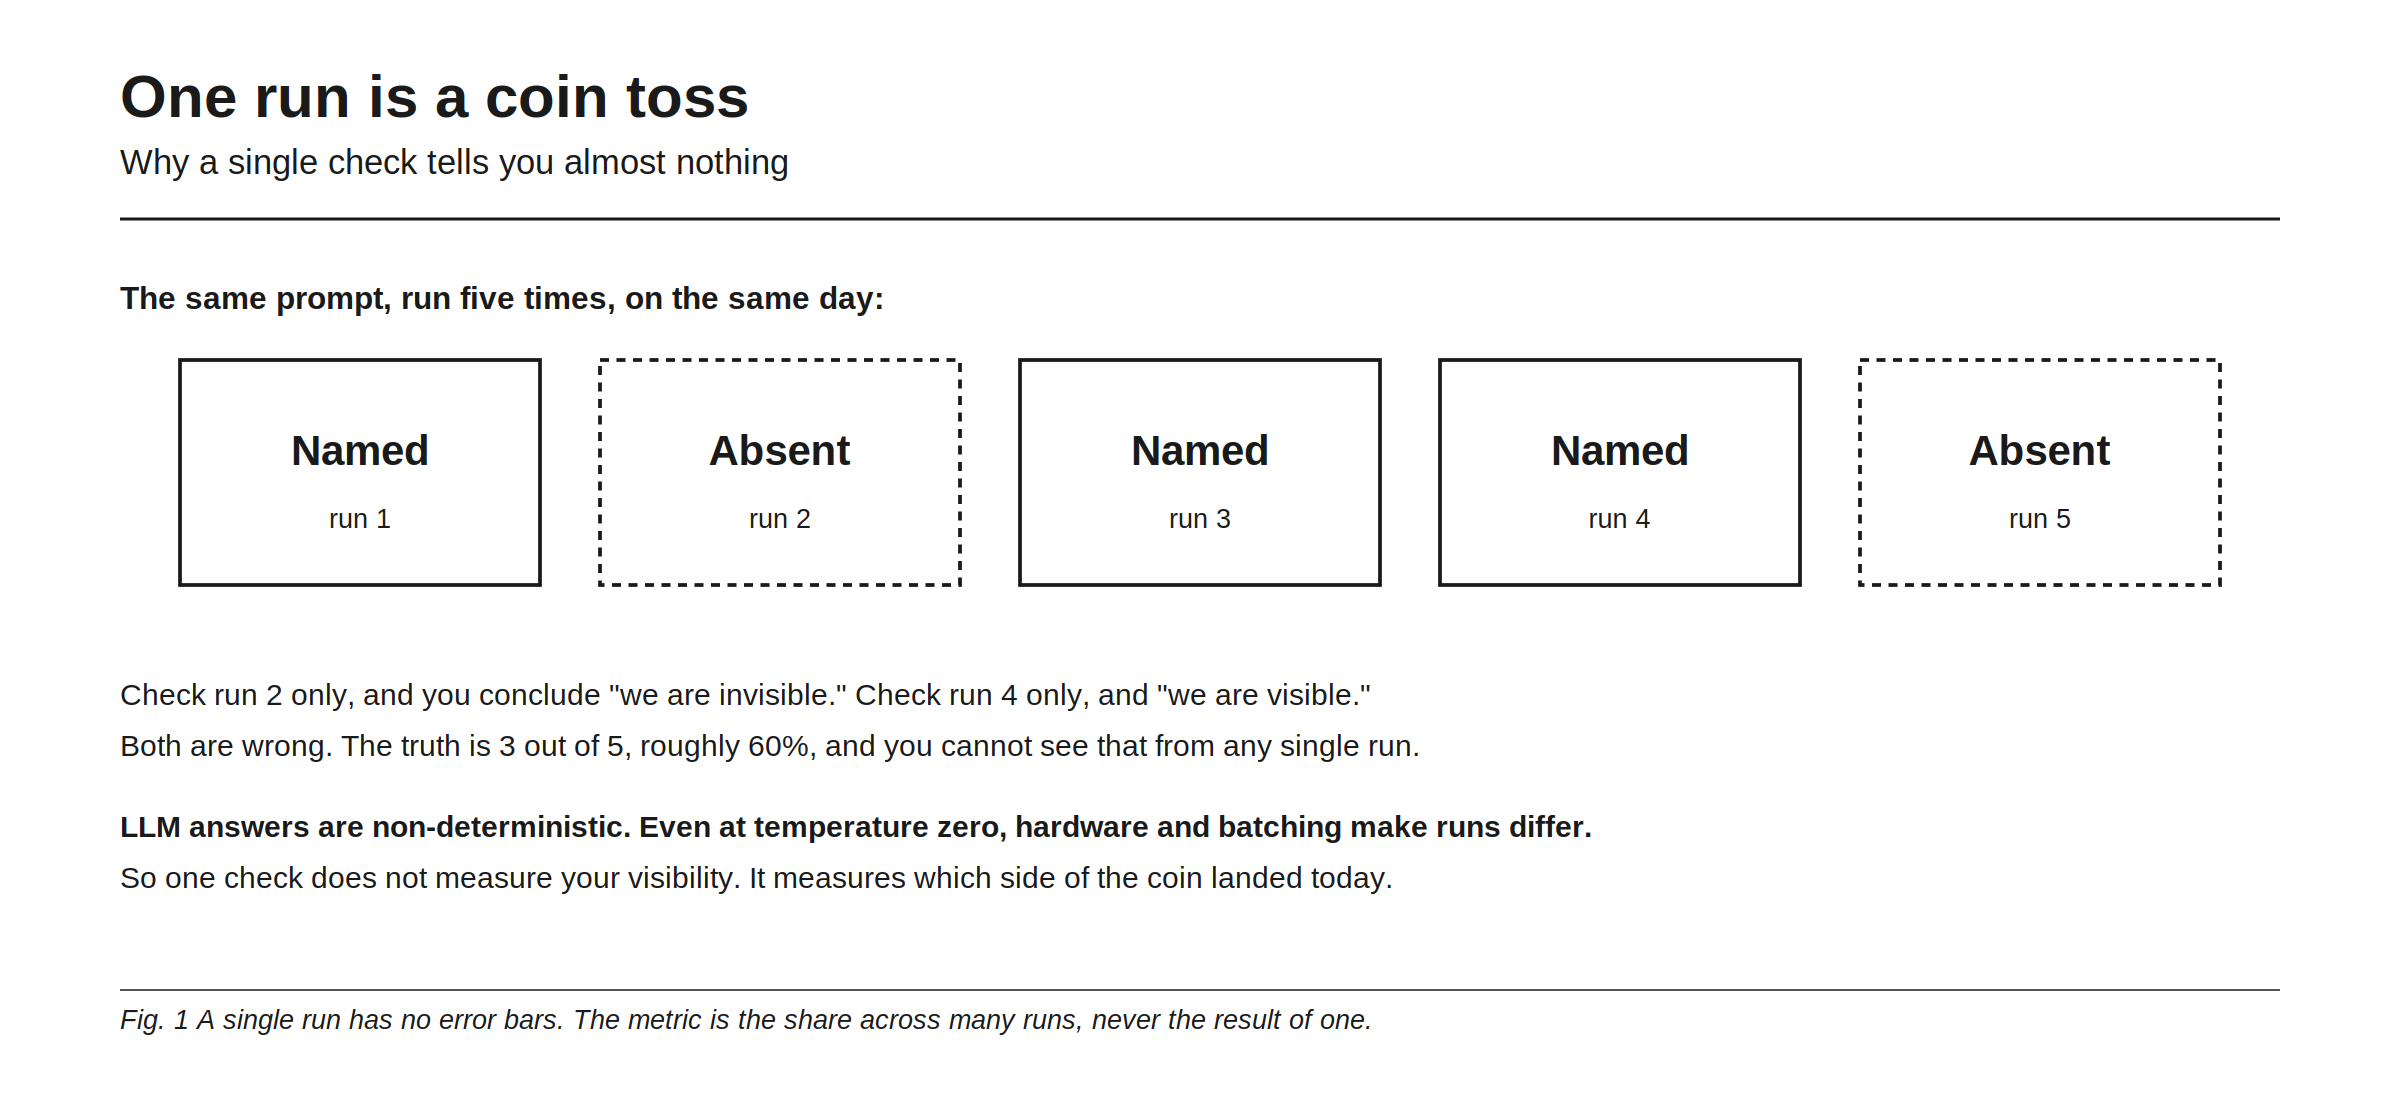
Run the same prompt five times on the same day and you might see: named, absent, named, named, absent. Check run two alone and you conclude “we are invisible.” Check run four alone and “we are visible.” Both are wrong. The truth is three out of five, roughly 60%, and you cannot see that from any single run.
This is not a quirk, it is how these systems work. LLM outputs are non-deterministic, and even at temperature zero, hardware-level effects like GPU parallelism, batching, and floating-point non-associativity make runs differ for the exact same input. So one check does not measure your visibility. It measures which side of the coin landed today. A single run has no error bars at all, which means reporting it as your number is quietly pretending the variance is zero. It is not.
The margin of error, and why it shrinks slowly
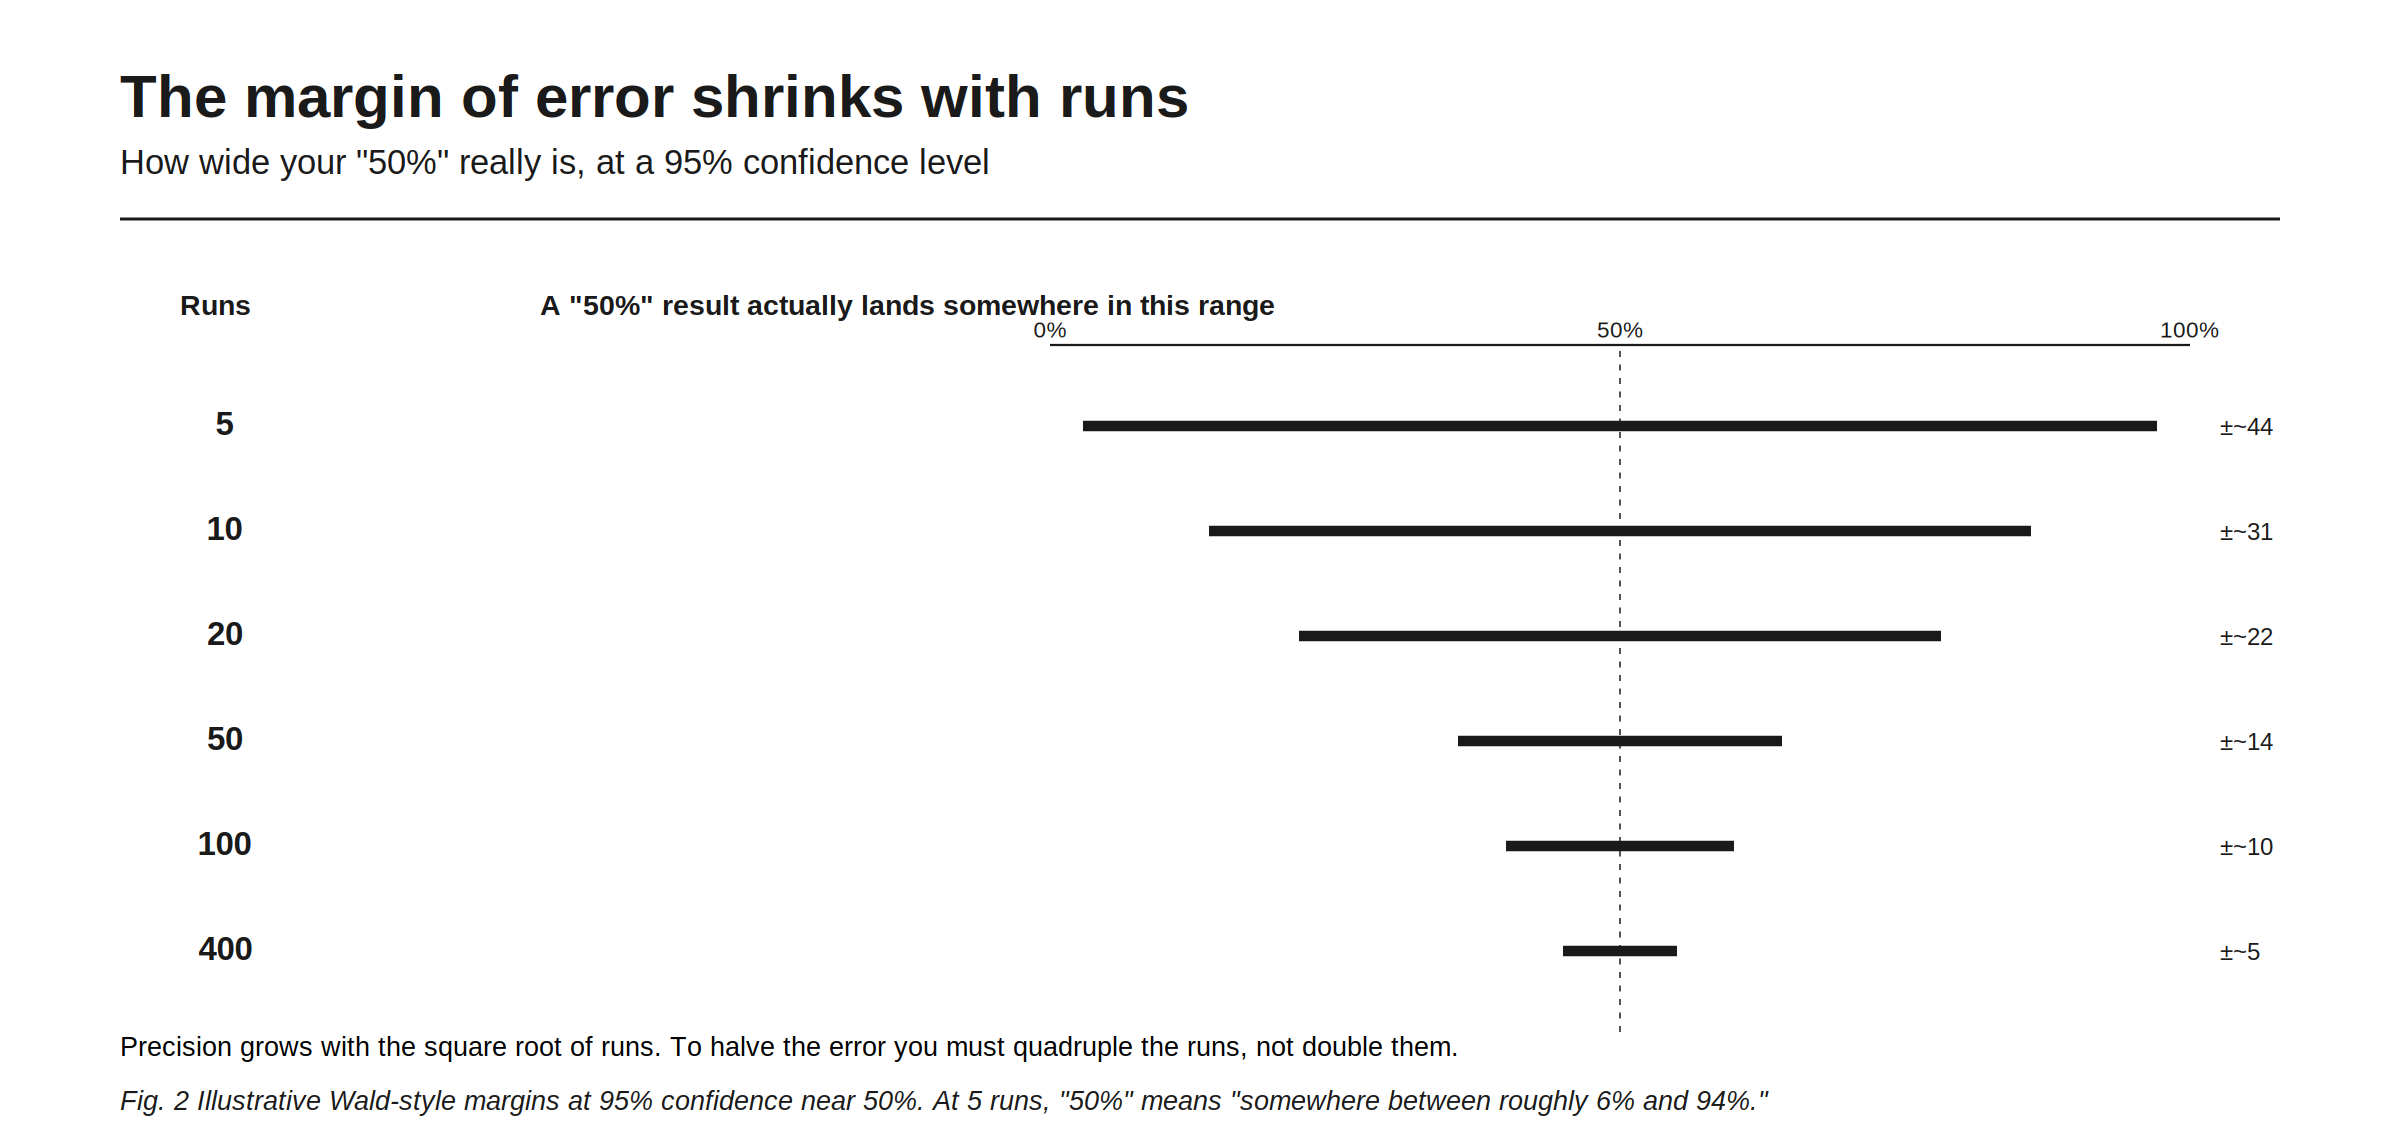
Here is the part that reframes everything. When you run a prompt n times and count how often you appear, you are estimating a proportion, and every proportion has a confidence interval around it. Near 50%, at a 95% confidence level, the rough margins look like this: at 5 runs, about ±44 points; at 10 runs, ±31; at 20 runs, ±22; at 50 runs, ±14; at 100 runs, ±10; at 400 runs, ±5. Read that top row again: at five runs, a “50%” result actually means “somewhere between roughly 6% and 94%.” That is not a measurement, that is a shrug.
A concrete example the testing world uses: an 18-of-20 result looks like a clean 90%, but its exact binomial 95% interval runs from about 68% to 99%. Same data, wildly different stories depending on whether you read the point estimate or the interval. And the cruel part is the shape of the curve: precision grows with the square root of runs, so halving your margin of error requires quadrupling your runs, not doubling them. Going from 20 to 40 runs barely helps; going from 20 to 80 is what moves the needle. This is why “just check it a few times” is not a strategy. The figures above are illustrative Wald-style margins near 50%, and real intervals (Wilson, Agresti-Coull) differ slightly, but the shape and the lesson hold.
Is a weekly change real, or just noise?
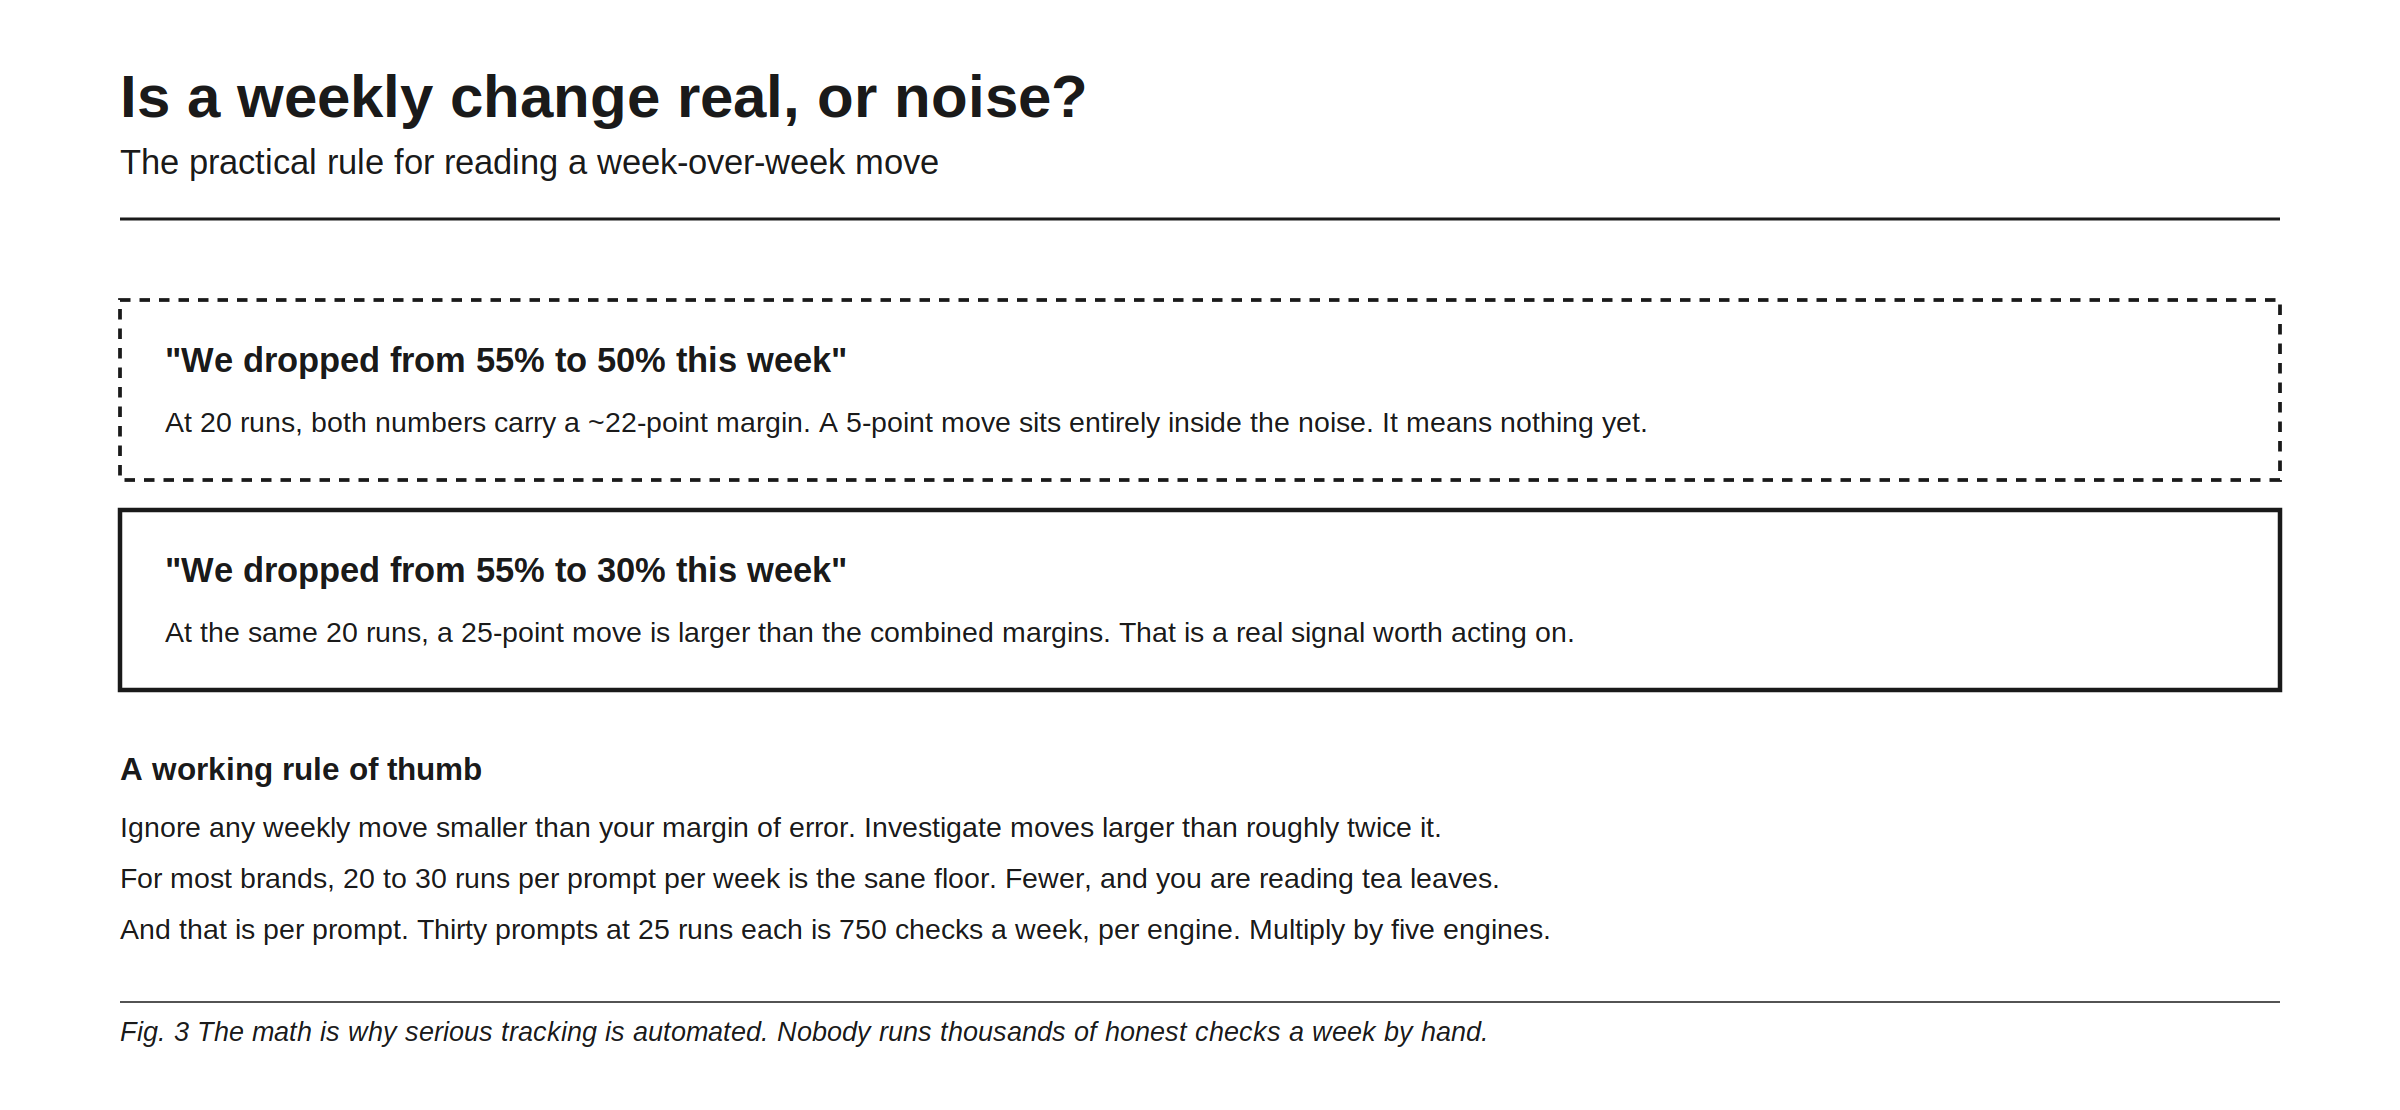
This is where the math becomes a decision rule you can actually use. Say you track at 20 runs per prompt, giving each number a roughly ±22 point margin. If you “drop from 55% to 50%,” that five-point move sits entirely inside the noise of both numbers. It means nothing yet, and reacting to it is chasing ghosts. But if you “drop from 55% to 30%,” that 25-point move is larger than the combined margins, and that is a real signal worth investigating.
So here is the working rule of thumb: ignore any weekly move smaller than your margin of error, and investigate moves larger than roughly twice it. For most brands, 20 to 30 runs per prompt per week is the sane floor; fewer than that, and you are reading tea leaves. And remember that number is per prompt: thirty prompts at twenty-five runs each is 750 checks a week on one engine, multiplied across five engines. The full monitoring discipline this feeds into is in how to monitor your brand across AI search engines.
Why this quietly settles the “which tool” argument
Two things follow directly from the math. First, most disagreements between AI visibility tools are not about accuracy, they are about run counts and denominators. A tool checking once shows you a noisy coin flip; a tool sampling properly shows you a stable share, and they will “disagree” for reasons that have nothing to do with your brand. That is unpacked in why two trackers never show the same number and the four-metric breakdown. Second, the moment you accept the run counts the math demands, doing it by hand becomes impossible. Nobody runs 750 honest checks a week per engine in a spreadsheet, across ChatGPT, Claude, Gemini, Perplexity, and Grok, sampling each prompt enough times to beat the noise. This is not a marketing argument, it is arithmetic: the required sample size is the reason automation exists in this category.
Rankry samples each prompt across runs to give you a stable share with the variance smoothed out, tracks the delta week over week so you can tell a real move from noise, and does it across every engine you run, seven available on every plan with any five active per project, from $99 a month on a no-card trial. The per-engine specifics that also affect variance are in which ChatGPT you are actually tracking and tracking brand mentions in Perplexity.
The short version
If you take one thing from the math: never trust a single AI visibility check, and never react to a weekly wobble smaller than your margin of error. A percentage without a run count behind it is a rumor. What that distribution actually looks like for a single buyer question, brand by brand, is in what 500 runs of one question look like. Run enough times to make the number stable, watch the deltas rather than the raw score, and treat any move inside the noise as nothing until it repeats. Do that, and you will make far fewer wrong decisions than the people staring at a number they checked once.
FAQ
How many times should I run a prompt to track AI visibility? At least 20 to 30 times per prompt per week for a usable signal. Fewer runs leave your percentage with a margin of error so wide it cannot distinguish a real change from random variation.
Why does ChatGPT give different answers to the same question? Because LLMs are non-deterministic. Even at temperature zero, GPU parallelism, batching, and floating-point effects produce different outputs for identical inputs, so the same prompt varies run to run.
Is a single AI visibility check reliable? No. A single run is a coin toss with no error bars. It tells you which way the result landed that time, not your true visibility. The trustworthy metric is the share across many runs.
How do I know if a weekly change in my AI visibility is real? Compare the size of the move to your margin of error. A move smaller than your margin is inside the noise and means nothing yet. A move larger than roughly twice your margin is a real signal worth investigating.
Why does doubling my runs barely improve accuracy? Because precision grows with the square root of the run count. To cut your margin of error in half you must quadruple your runs, not double them. This diminishing return is why proper tracking needs large, automated sample sizes.
Can I track AI visibility accurately by hand? Only at tiny scale. The run counts the math requires, dozens of samples per prompt, across many prompts and five engines, add up to hundreds or thousands of checks a week. That volume is why the category is automated.
Get a stable AI visibility share with the run-to-run noise smoothed out, and deltas you can actually trust, across every engine you run. Start a free 7-day Rankry trial, no card, first report in two minutes.